
Alice Hudson Award - Gallery of Best Printed Map Awardees
2025
Hunter College - 68th Street Campus Map
by Erin Witt

I still remember my first few days at Hunter College—how overwhelming it felt to navigate a campus that was both exciting and unfamiliar. This map is a perspective drawing of the 68th Street campus buildings, created as a visual guide to help new students find their way more easily. To bring it together, I incorporated symbols of New York City alongside recognizable elements of the college. The final piece is more than a navigational aid—it’s a celebration of Hunter’s identity and its place within New York City, created to warmly welcome each new member of the community.
Intended Audience: Hunter College's students and visitors
Software Used: Procreate for the iPad, Adobe Illustrator
Data Sources: Google Earth. (2022). 3D view of Hunter College [Satellite imagery]. Google. https://earth.google.com/
2024
NYCParks Water Fountain Locations in Top and Bottom 5% Queens Census Tracts Based on Median Income (2022 Inflation Adjusted Dollars)
by Lianna Cabili
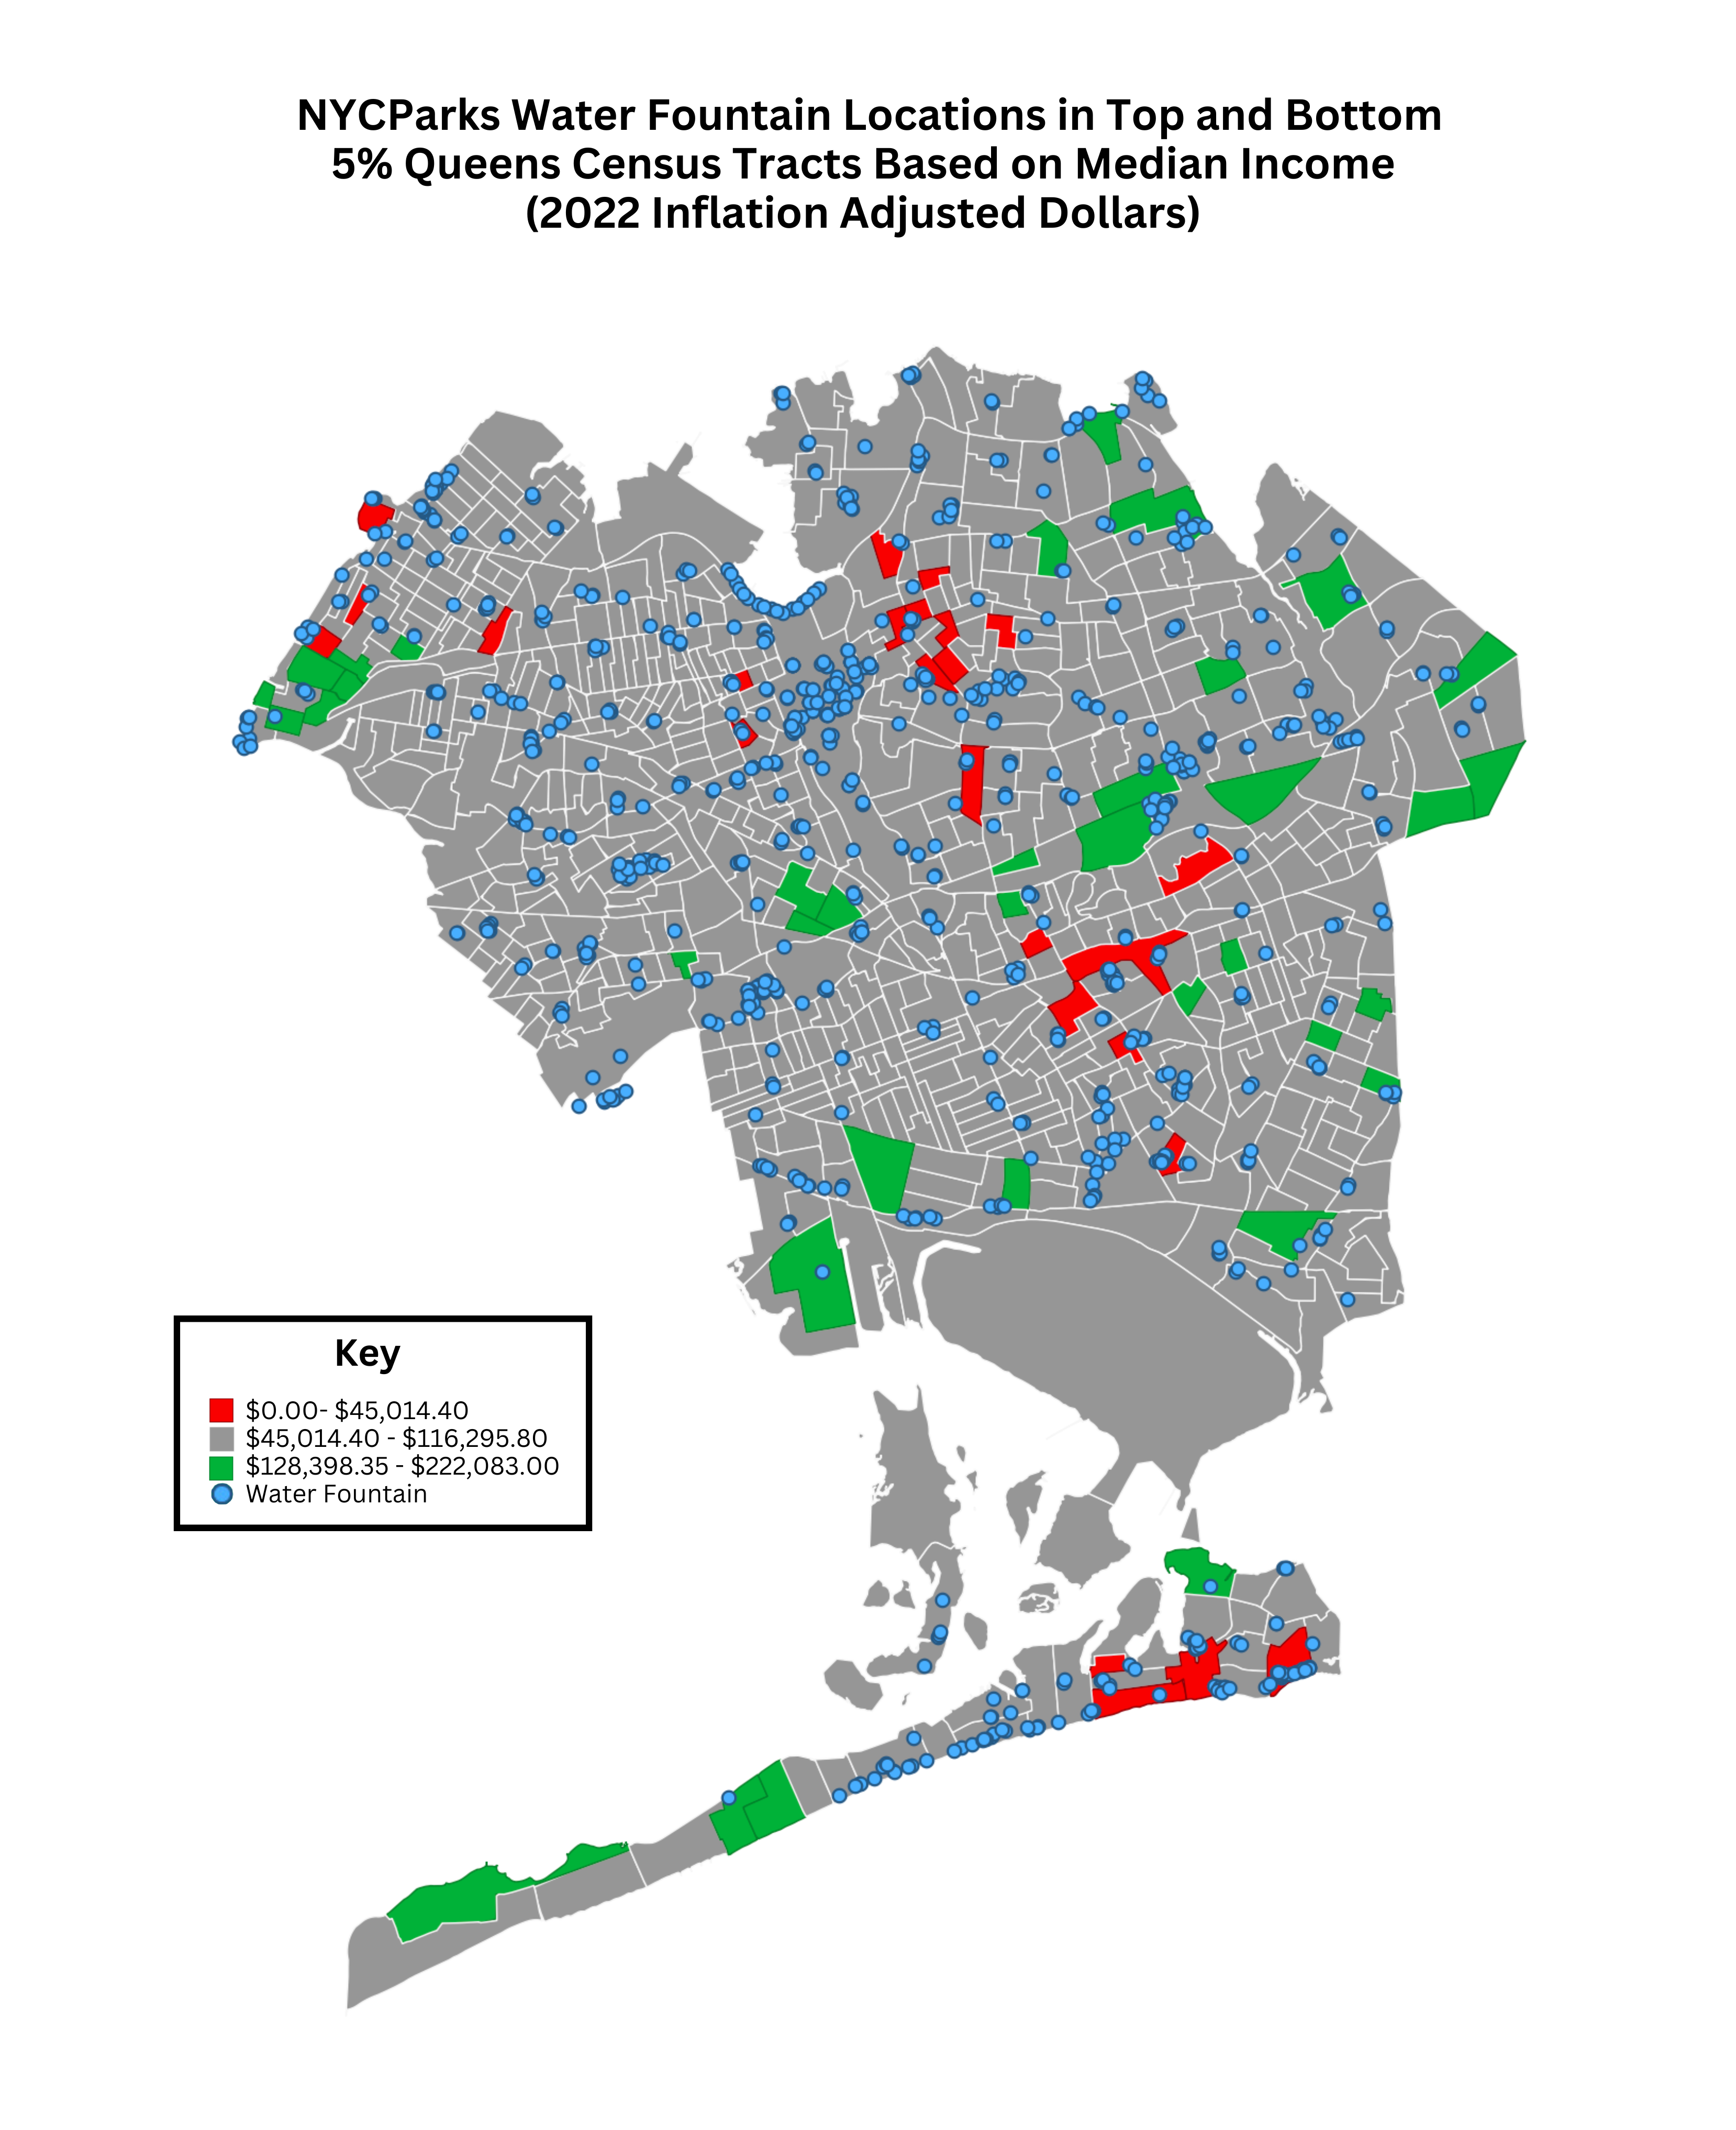
This map depicts the locations of water fountains within the NYCParks system in New York City, specifically in the borough of Queens. In this map, Queens is segregated by census tracts as defined in the year 2020. This census tract definition has been used up to present day. In red are the bottom 5% of census tracts with respect to median income, with the exception of census tracts that have a median income of purely $0.00, as these represent nonresidential spaces such as airports and parks that lack median income data. In green are the top 5% of census tracts with respect to median income. In grey are all other census tracts. Water fountain locations are indicated by blue circle markers. The question this map is attempting to answer are the theoretical public water availability through a socioeconomic lens.
Intended Audience: NYC Parks / Social Justice Groups
Software Used: QGIS, Excel, and Canva.
Data Sources: Bytes of the Big Apple, data.census.gov
2023
Limited Edition Central Park Map
by Lisa Gaetjens
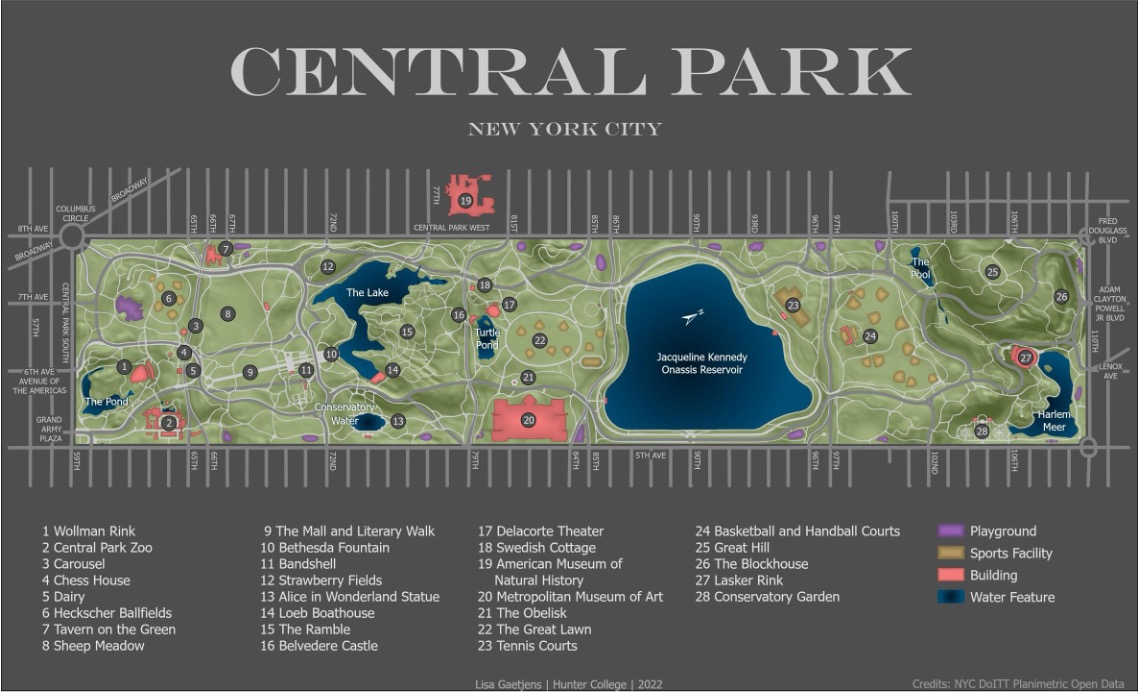
Design a limited-edition map of Central Park to be published by the Central Park Conservancy. Create a map of Central Park that represents the terrain as well as relevant recreational, geographic, cultural, and other features to create a compelling and attractive composition for a general audience.
Intended Audience: General audience
Software Used: ArcGIS Pro
Data Sources: Terrain DEM and layers for buildings, sports facilities, water features, playgrounds, and surrounding streets provided by Professor Doug Williamson. Paths within Central Park data from NYC DoITT Planimetric Open Data
2022
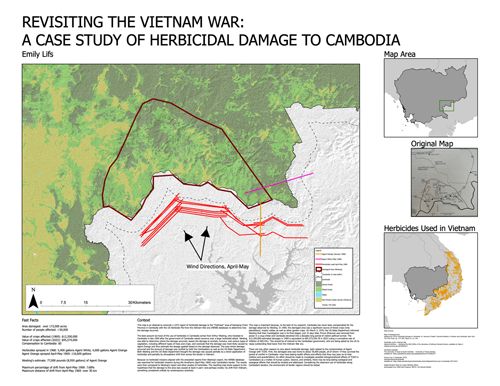
Revising the Vietnam War: A Case Study of Herbicidal Damage to Cambodia
by Emily Lifs
This map is an attempt to reconcile a 1972 report by Arthur Westing of herbicidal damage to the "Fishhook" area of Kampong Cham Province in Cambodia with the US Herbicide File from the Vietnam War era (HERBS database) to determine how the damage occurred.
The best account we have of the use of herbicides in Cambodia comes from Arthur Westing, who traveled to Cambodia in late 1969 after the government of Cambodia raised concerns over a large herbicidal attack. Westing was able to determine where the damage occurred; assess the damage to animals, humans, and various types of vegetation, including different types of trees and crops; and conclude that the damage was most likely caused by Agent Orange and thus estimate the dosage applied based on the damage they observed. The area where damage occurred and the amount of damage was verified by both the Cambodians as well as the US State Department. Both Westing and the US State Department thought the damage was caused partially by a direct application of herbicides and partially by atmospheric drift from across the border in Vietnam.
Because no herbicidal missions aligned with the anecdotal reports from Westing's report, the HERBS database was searched for herbicidal missions
during the timeframe (April-May 1969) near Cambodia's border. The results were then compared to Westing's report and other studies of herbicides. The resulting map lends support to the hypothesis that the damage to the area was caused at least in part—and perhaps mostly—by drift from Vietnam.
This map is important because, to the best of my research, Cambodia has never been compensated for the damage observed by Westing. In 1969, the damaged area was a significant source of forest crops (tree plantations), mostly rubber, as well as other garden crops. On March 3, 1970, the US State Department informed Westing that their investigation was in its final stages; just 15 days later, Prince Sihanouk was removed from power in a coup dʼetat and Cambodia devolved into a 22 year long period of violent political turmoil. The $12.2 million estimated damages in 1969 is equivalent to $95,573,536.78 in 2022 (using a cumulative rate of inflation of 683.4%). This should be of interest to the Cambodian government, who area being asked by the US to repay outstanding loans from the Vietnam War era.
There are two other reasons to care about herbicidal damage, both related to the contamination of Agent Orange with TCDD. First, the damaged area was home to about 30,000 people, all of whom—if they survived the period of conflict in Cambodia—may have lasting health effects and effects that they may pass on to their children and grandchildren. An effort should be made to investigate possible intergenerational effects of TCDD in Cambodians as a matter of human justice. Second, and similarly, there may be long-lasting ecological effects that should be studied and addressed. Considering the extensive use of herbicides along Cambodiaʼs borders, the environment of border regions should be tested.
Intended Audience: researchers, NGOs, my thesis committee
Software Used: Jupyter Lab (Python), QGIS, ArcGIS Pro
Data Sources:
- Map of Damaged Area
Westing AH (1972) Herbicidal Damage to Cambodia. In: Harvest of Death: Chemical Warfare in Vietnam and Cambodia. New York: The Free Press, pp. 177–205; Figure 4-1, p. 183. - Herbicides used in Vietnam War
National Archives — Herbicide File OSD (Office of the Secretary of Defense)
Revised Version, available at: https://catalog.archives.gov/id/34922617 - Cambodia shapefile
The University of Texas at Austin GeoData — University of Texas Libraries available at: https://geodata.lib.utexas.edu/catalog/stanford-mr193kj1077 - Forest cover in Cambodia (1973)
OpenDevelopmentCambodia available at: https://data.opendevelopmentcambodia.net/en/dataset/forest-cover-in-cambodia-1973-2014 - Digital Elevation Maps (to create hillshade effect) downloaded from USGS Earth Explorer (SRTM 1 Arc-Second Global)
2021
None
2020
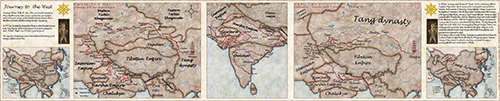
Journey to The West
by Mingtao Lei
Xuanzang was one of the most famous Buddhist monks in history. One of the Four Great Classical Novels of Chinese literature, Journey to the West, was inspired by the true story of Xuanzang. This map presents a virtualized story of where Xuanzang visited in the ancient time and the boundaries of each ancient countries.
Intended Audience: To everyone who interests in the ancient history of Asia region, readers of the literature "Journey to the West"
Software Used: Arcgis Pro
Data Sources:
- 《大慈恩寺三藏法師傳》(Chinese Edition) by (Tang) Hui Li; Yan Cong (Editor)
On Yuan Chwang’s Travels in India tr.Thomas Watters. Reprint. New Delhi, Munshiram Manoharlal, 1996 ISBN 81-215-0336-1. - Academia Sinica, Chinese Civilization in Time and Space, Version 1, (Taipei, September 2002).
- Natural Earth
2019
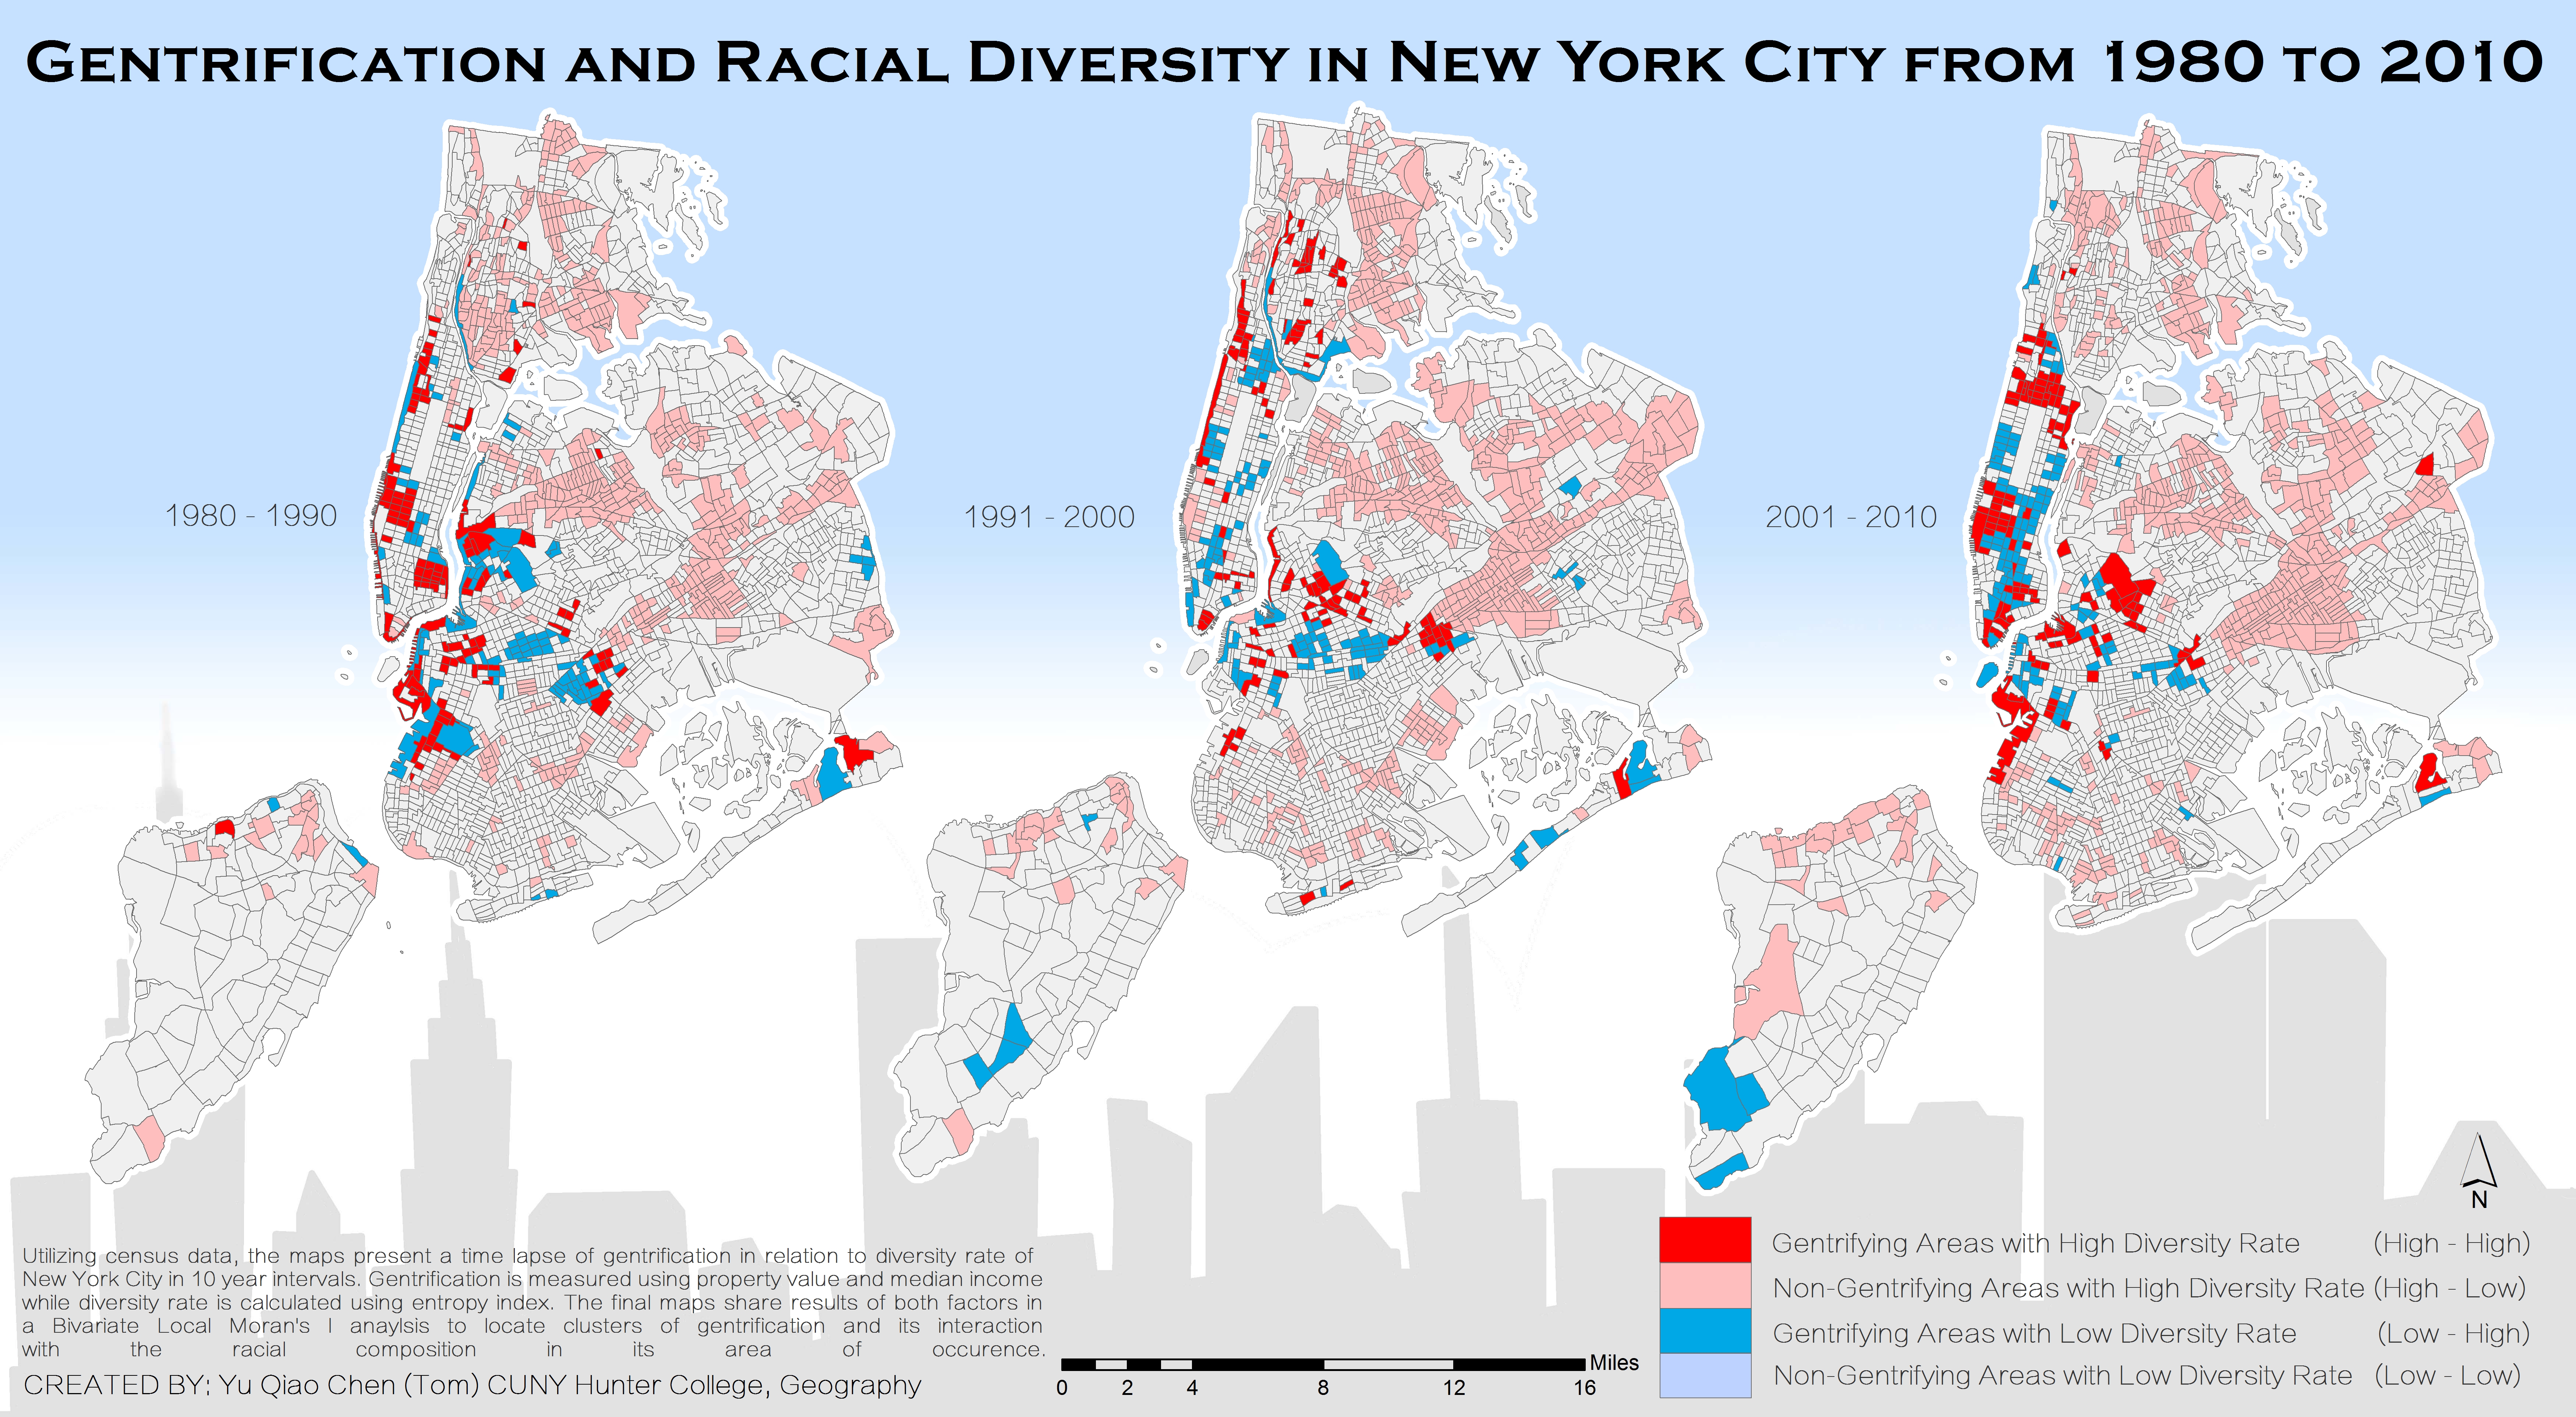
Gentrification and Racial Diversity in New York City from 1980 to 2010
by Yu Qiao Chen
Question: Does Gentrification Promote or Diminish Racial Diversity in New York City?
This map was created in part for my undergraduate thesis. The map's purpose is to unveil:
1) clusters of gentrification in New York City and its interaction with racial diversity. Does gentrification occur in areas of high diversity or low diversity rate solely? Or is it a mixture?
2) patterns of gentrification occurrence and change of diversity rate throughout time.
On a census tract level, the maps are results of a Bivariate Moran's I analysis using gentrification (determined by house value and median income) and diversity rate (entropy index) between 3 separate time periods.
Contrary to the common belief of white residents displaying people of color, gentrification does not solely induce homogeneous demographic. Harlem of Manhattan, for example, has went through gentrification but exhibits a diverse resident population. Social mixing may co-exist with gentrification. On the other hand, Brooklyn Heights falls into the category of ""traditional gentrification"", which wealthy home buyers drives out poorer resident; it grew to become a community with more White residents. Diversity rate and gentrification may be correlated factors positively and negatively.
Intended Audience: Geographers, Researchers, residents of NYC
Software Used: ArcMap, Geoda, Microsoft Excel
Data Sources:
- IPUMS, NHGIS
Steven Manson, Jonathan Schroeder, David Van Riper, and Steven Ruggles. IPUMS National Historical Geographic Information System: Version 13.0 [Database]. Minneapolis: University of Minnesota. 2018. https://www.nhgis.org/