Working With Census Data
GOALS
Through
this lab exercise, you will learn to:
-
download data for
selected geographic areas from the Census Bureau website for two time periods
(1990 and 2000)
-
import this data into
a spreadsheet program (Excel)
-
organize and summarize
the data to provide an interesting
- Use Internet
Explorer and enter the Census Bureau website: www.census.gov
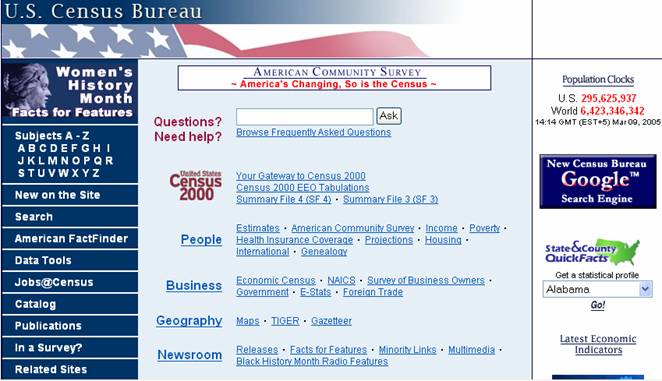
- Enter the American
Fact Finder page by clicking on the appropriate icon on the left frame of
the main page. If you are
successful, the screen will look like this:
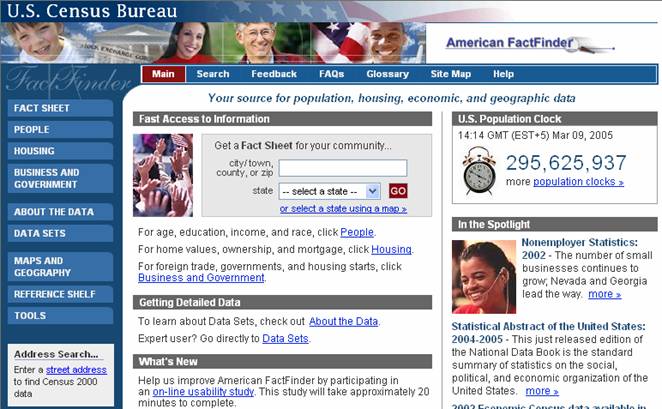
Click on Data Sets. You will find that by default
the radio button is set to Summary File 1. Learn more about this particular
dataset by clicking the appropriate item on the bottom right. Read through this
page briefly.
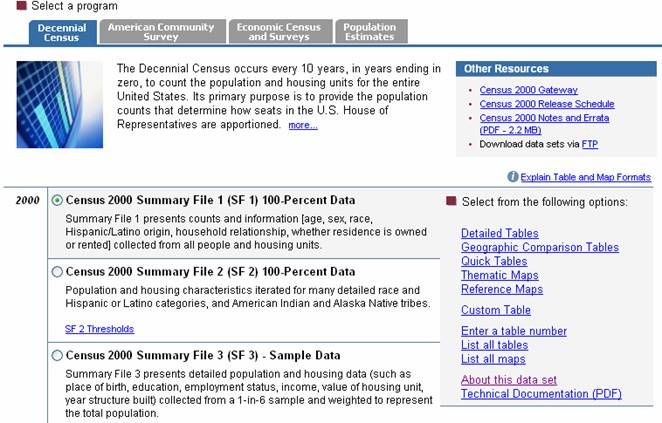
- Next, click on Quick
Tables and select geography type State, chose the state of
 .
.
You are now given a list of tables to chose from. At
this point, we just want to get an overview, so select DP-1: Profile of general
Demographic Characteristics. Add it to the current table selections.
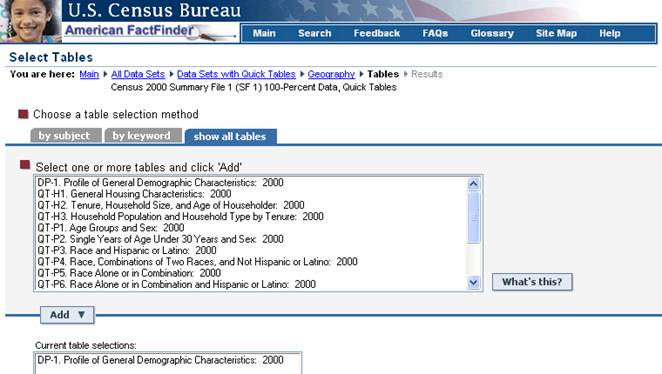
Upon clicking ![]() , you should now see a set
of summary statistics that describe the state of
, you should now see a set
of summary statistics that describe the state of
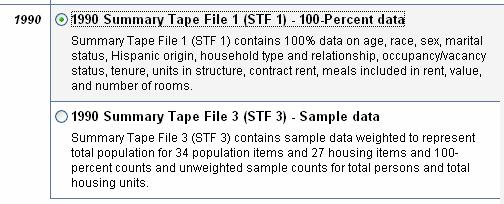
Q1: The caption above the table states that this data is a
100 Percent Data. What is the difference
between a 100% count and a sample count?
- You are now ready to
download and save this file. Create
a new folder on your U: drive called U:\GTECH201\Lab07.
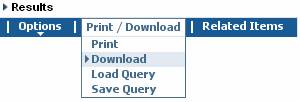
Go up to the top of the webpage and select the
download option within the PRINT/DOWNLOAD choice.
- You will be given a
number of options and to understand the differences, you will perform this
step in at least two variations.
Once you press the OK button, a window will pop up with the
following text: “To help protect your security, IE blocked this site from
downloading files to your computer. Click here for options…”. Click as asked
and then choose the ‘Download File’ option. This is a nuisance, which we will
try to get rid off in the next weeks. In the mean time, this window will pop up
whenever you want to download census data here in our lab facilities and you
will have to make two extra mouse clicks.
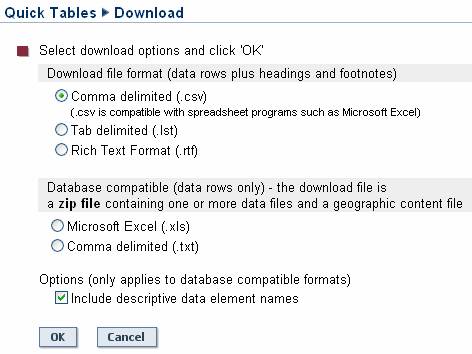
a)
Choose the
default option (.csv) and save the file to your U: drive. In the process of
saving, rename the file to CAdem.csv for
b)
Next go again
to Print/Download and this time select the Microsoft Excel option. Rename the
file as part of your save operation to CAdem.zip.
Use
the MS Explorer to got to your U: drive and double-click one of the .csv file
to load it into MS Excel. The double-click the .zip file and extract the first
Excel file to CAdem.xls. Double-click on the latter and compare the two file
contents.
Q2: Describe the difference
between the two ways of organizing data that is exemplified by the two files
that you just loaded into Excel.
6. Now that you understand how to access census data, let’s
change the geographic selection to get the data for the original research
question. Change the geography of your selection by clicking on Geography in
the You are here row near the top of your browser window. ![]()
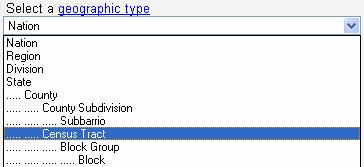
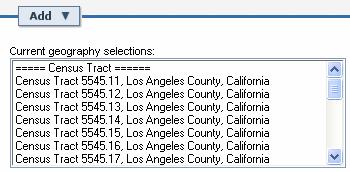
7. Change the geography type to Census Tract,
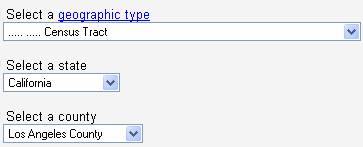
Select
the state of
Now
you are ready to select census tracts. Each
student in this class will download and use a different set of census tracts to
complete the rest of this lab exercise.
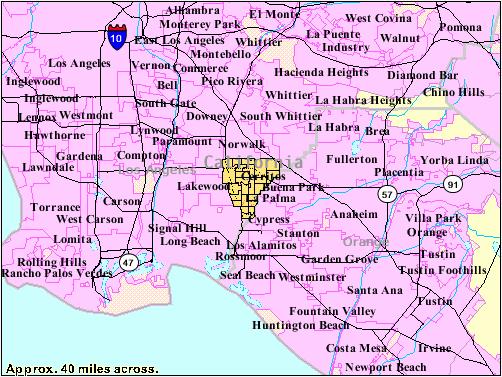
Our
area of study is a place called
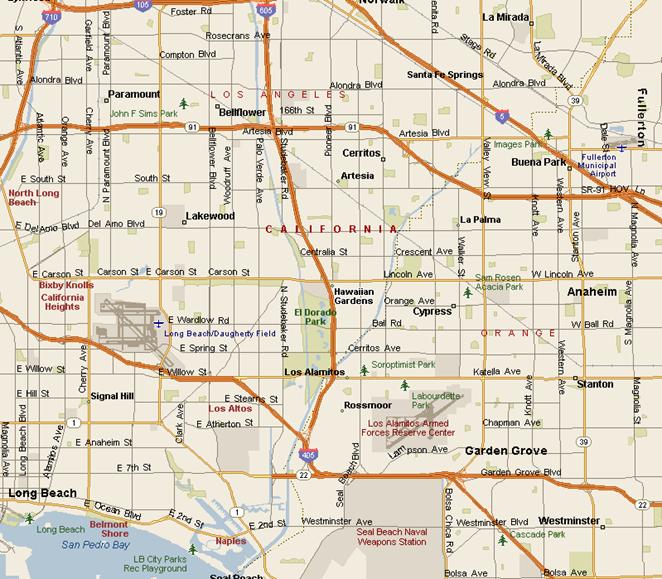
while the next is how US Census depicts our area of interest.
Our goal is to use census data from 1990 and 2000 to describe the demographic profile of the area, focusing on change. After you have examined the demographic profile (variables of age and race), you may want to consider two other variables, income and education to complete your description. But, first things first. By the end of the hour, you must download and save 1990 and 2000 data for the two tracts that you have been assigned.
- First, remove
|
|
Name |
Census Tracts |
|
1 |
Arboleda |
5545.11; 5545.12 |
|
2 |
Blair |
5545.13; 5545.14 |
|
3 |
Camacho |
5545.15; 5545.16 |
|
4 |
Compitello |
5545.17; 5545.18 |
|
5 |
Dadamo |
5545.19; 5545.21 |
|
6 |
Damas |
5546; 5547 |
|
7 |
Flowers |
5548.01; 5548.02 |
|
8 |
Holmes |
5549; 5551.02 |
|
9 |
Hsiao |
5552.02; 5552.11 |
|
10 |
Ibraheem |
5552.11; 5552.12 |
|
11 |
Jarama |
5545.21; 5545.22 |
|
12 |
Kess |
5545.19; 5545.21 |
|
13 |
Konishi |
5546; 5547 |
|
14 |
Lewis |
5548.01; 5548.02 |
|
15 |
Mohan |
5549; 5551.02 |
|
16 |
Munoz |
5552.02; 5552.11 |
|
17 |
Ng |
5545.17; 5545.18 |
|
18 |
Ortiz |
5545.15; 5545.16 |
|
19 |
Rechner |
5545.13; 5545.14 |
|
20 |
Recio |
5545.11; 5545.12 |
|
21 |
Roberts |
5552.11; 5552.12 |
|
22 |
Rodrigues |
5545.13; 5545.14 |
|
23 |
Rozmus |
5545.17; 5545.18 |
|
24 |
|
5548.01; 5548.02 |
|
25 |
Stark |
5546; 5547 |
|
26 |
Thomas |
5545.19; 5545.21 |
|
27 |
Urata |
5545.15; 5545.16 |
|
28 |
Zaromatidis |
5552.11; 5552.12 |
Depending
on the time of the day, the US Census web server may be a bit busy. In this
case you will the following icon:

- For the 2000 data, download and save the data
as [lastname]_2000. Remember that when you click the .xls option, you are
actually downloading a zip file that contains the Excel spreadsheet.
For
the 1990 data, you will have to go back all the way to the All Data Sets option
in ![]() .
.
Go
to the bottom of the page and select 1990 STF 1 data.
- Now you go through exactly the same sequence of
steps for selecting your census tracts as for the 2000 data. Make sure
that when you save the files to your local U:\ drive, you change the name
to reflect it being 1990 data.
10. Once you have downloaded all the data you think you will need, first spend some time familiarizing yourself with the data set. Then proceed to answer by answering the following questions
Q3a: What is the population of your two census
tracts combined (i) in 1990 and (ii) in 2000?
Q3b: What is the racial breakdown in the two time
periods for your two census tracts combined? (Five Groups – White, Black,
Asian, Native American, Other)? In other words, what is the ratio of one race
versus another?
Q3c: What is the age profile/breakdown in the two
time periods for the combined census tracts? (Choose an appropriate age
breakdown that is comparable across time periods)?
Q3d: Are the two tracts you aggregated similar to
each other or completely different? Explain, e.g., in what respect are they
similar, in what respect are they different?
Compile
all your answers in a little text file (e.g. using Notepad) and submit them to Jing Li
either as an email attachment or by copy and pasting your answers into the body
of your email. Make sure that you provide a telling subject header for your
email message and that you send a copy to yourself. Do not consider your
submission to be complete before you have received your own email message.