Intersecting geographic data
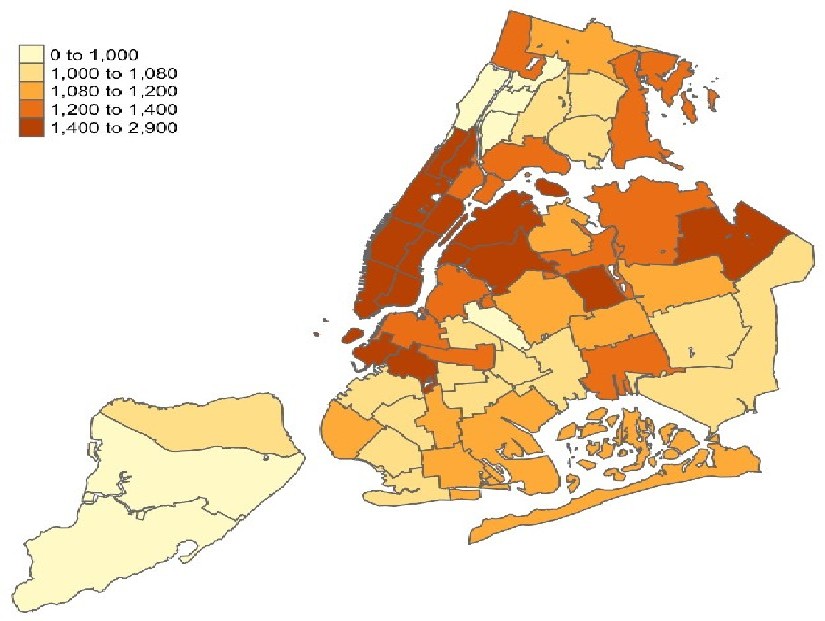
GIS-based overlay analysis is used to generate different thematic maps that show spatial distribution of water quality sampling and the online/in person survey results, and water quality complaints by NYC residents.
This helps us to understand the spatial distribution of the water quality sampling and survey results. We also use the GIS maps to explore the spatial differences in perceptions of bottled water quality vs. tap water and drinking water fountains in different areas of NYC.