Redefining Criteria for Selecting Protected Areas for Tigers
The government of Thailand has certain parcels of land set aside as protected areas for tiger habitats. They wish to redefine the protected areas
based on new information from zoologists.
The new protected areas must meet the following criteria:
- elevation
must be between 1000 meters and 2000 meters.
- slope must be less than 2 degrees.
- slope aspect must be northeast, or north, or northwest.
- protected areas must have an area greater than zero.
You will create grid layers to do the analysis and present your analysis using the Cartographic Method (impt!). Your final products will be:
1. Hard copy write up of the steps you took to conduct your research and a report of your analysis using the Cartographic Method or
you
can post your write up on your website.
2.
A layout on your web page that contains the following:
- a map of the new protected areas.
- images of the individual grids you produced.
Methods:
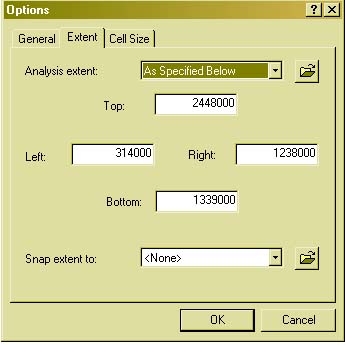
| The point elevation data is for within
the country boundaries of Thailand. Notice that the
shape of Thailand includes a long thin peninsula
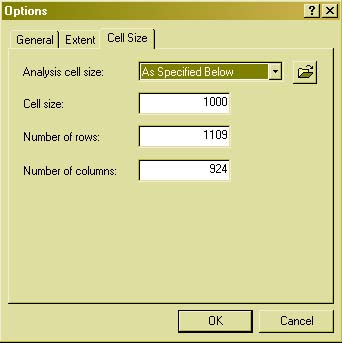
surrounded by water. We now know that tigers do not reside on the peninsula so we will reduce the extent of our analysis to the northern portion of the country. [Step 1]: To change your view extent highlight 'Spatial Analysis' and 'Options'. Under 'General' set your working directory. Under 'Extent' input the values below. Under 'Cell Size' input the values below. |
 |
 |
| Now that you have your new working
extent [Step 2]: Use 'Spatial Analyst' convert (a) the
'protected areas' layer (polygon) to a grid format by
using 'Convert' and 'Feature to Raster,' and (b) the
point 'Elevation Data' into an interpolated grid using
'Interpolate into Raster' and Inverse Distance Weighted (IDW).
It is suggested that you use the 'Category' field when
converting your 'protected area' layer and 'Elevation in
Meters' as your Z value when converting your 'elevation'
data (keeping all other defaults constant). [Step 3]: Run your raster analyses to accomplish the above objectives using 'Spatial Analyst' and 'Surface Analysis'. Review the lecture notes on the different interpolation schemes. |
Other Hints:
| Be sure to check your data before conversions and/or conducting analyses. Knowing our data is of utmost importance. Your 'View Properties' should be set to meters. Try different cell sizes and other parameters to become familiar with the functions and how they operate when conducting your analyses. Zooming in and out to view your results can also help keep you on track. |
Have fun working in the raster world!