Lab #3
|
Measuring Crime Density
The New Police Department (NYPD) is interested in measuring the density of crime around schools (within 0.25km) during school hours (M-F, 7:00 AM to 4:00 PM) vs non-school hours. Is there a significant difference in crime between school and non-school hours and is there a difference in crime based on distance from the schools? Your final product will be a web page presentation to the NYPD supplemented with a hardcopy write up of the procedures and analysis in the format of the Cartographic Model.
A density map is a raster layer of data requiring the use of ArcGIS Spatial Analyst extension for analysis. You will create buffers around schools and create themes of crimes that occur during school and non-school hours. Next, you will create density maps for each new theme of crime. Create histograms of the data and compare.
Create a lab3 directory to store all the necessary files you will copy from u:/scratch/gisII/lab3/. Use the files in your lab3 directory to create a new ArcGIS Map Document for your analysis. Be sure to set the path for the working directory. Under View -> Properties, set Map Units to meters and Distance Units to kilometers.
Hints:
· Create subsets of the crime data since they are much easier to work with than the entire crime data set.
· When creating the buffers, ArcGIS asks if you wan to dissolve the adjoining buffers. The correct answer is Yes. If two buffers overlap, the overlapping boundaries are removed.
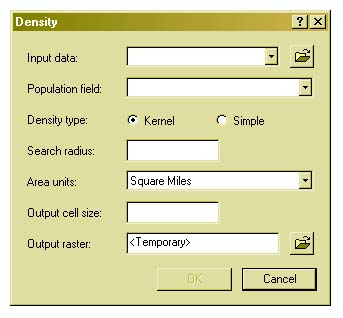
· When calculating density of the themes you create you will have to set some parameters to the values in the graphic below.
· The density themes will have legends with different value labels making them difficult to compare. Load in the standard legend .avl file.
For your web page:
·
Create 4 maps (layout format) showing crime density
for:
entire area - school hours
entire area - non-school hours
buffered areas - school hours
buffered area - non-school hours
·
Create 4 histograms of the crime data:
entire area - school hours
entire area - non-school hours
buffered areas - school hours
buffered area - non-school hours
Write up should:
· Discuss other ways the data could have been analyzed.
· Discuss the software limitations.
· Descibe the procedures you used.
· Discuss your results - analysis in the form of the Cartographic Model.